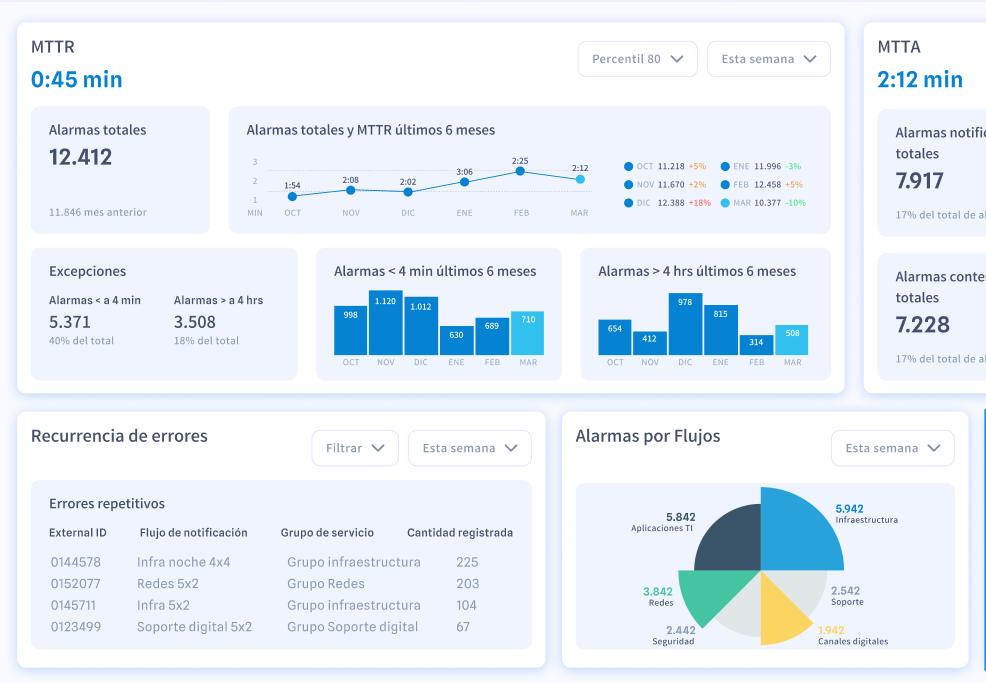
Real-time visibility of your operation

Understand
what is happening,
while it is happening.

Visualize key metrics such as MTTA, MTTR, alert volume and incident recurrence in real time to make informed decisions and improve your operation.

24Cevent-dashboard

- The problem is not having data -

Not knowing what is happening in real time

This is what is happening today

in most operations

No clear visibility of response time

It is not known how many alerts are actually managed

No repetitive errors identified

Decisions are made with partial information

Problems are repeated without learning

And without visibility, improvement becomes impossible.

When you see your operation in real time, you can control it.

Measures response times (MTTA)

Visualize how long it takes to react to an alert from the moment it is detected.

Measures resolution times (MTTR)

Understand how long it takes your team to resolve incidents from start to finish.

You detect recurring errors

Identify repetitive incidents and focus improvements where it really makes an impact.

You analyze volume and behavior

Understand how many alerts are generated, when and how they evolve over time.

You evaluate performance by teams

Visualize which teams respond best and where there are opportunities for improvement.

Real-time data

without manual effort

Events are recorded automatically


Every alert, action and status change is recorded in the system.

Data are structured


The information is organized into clear and comparable metrics.

Displayed on dashboards


Data is presented in real time using graphs and key KPIs.

Patterns are identified


Trends, recurrences and anomalies in the operation are detected.

Informed decisions are made


Teams can act based on real data, not assumptions.

What is not measured cannot be improved.

You don't just manage incidents.
You learn from them.

- Every alert and every action is transformed into data that helps you to continuously improve your operation - and that's what we do.

When you have no visibility

the impact is constant

Teams that do not know if they are getting better or worse

Unexplained recurring incidents

Lack of control over response times

Difficulty in justifying operational decisions

Problems that escalate without being detected in time

What changes in your operation

What metrics are key in incident management?

Key metrics include MTTA (response time), MTTR (resolution time), alert volume, incident recurrence and team performance. These allow you to understand the status of your operation and continuously improve your processes.

Doubts?

What is MTTA and why is it important?

MTTA (Mean Time to Acknowledge) measures how long it takes the team to respond to an alert.
It is key to assessing incident response capability.

What is MTTR and how does it impact the operation?

MTTR (Mean Time to Resolve) measures the total time to resolve an incident.
Reducing it improves continuity and user experience.

Are the metrics updated in real time?

Yes.
Dashboards are continuously updated with information from your operation.

Can I filter or segment the information?

Yes.
You can analyze metrics by period, team or flow.

Does this require manual configuration?

No.
Metrics are automatically generated from alert and incident management.

Start to see what you are not measuring today.

Explore your metrics and discover opportunities to improve your operation.